Logistic Regression
- Features vector
- We want to find the weights
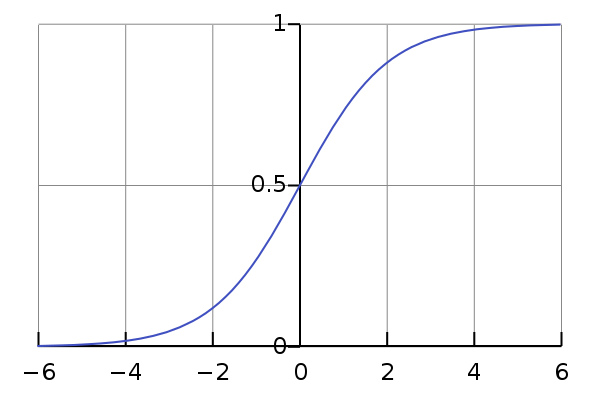
- Classification is done using Sigmoid function:
Likelihood Approach
More compactly,
Cost/ Likelihood Function
Log-likehood function
We want to maximize the likelihood function, or minimize the negative of the likelihood function.
Graphical illustration of the cost function
- cost = , when

- cost = , when y=0

Solve using LMS algorithm:
Note Unlike linear regression, here, h(x) is nonlinear function of theta and x
Metric
Accuracy works well for problem when the number of positive and negative classes are not skewed. However, if one of the class is skewed, then accuracy might perform really poorly. Note that, we usually assign the class with few samples as ‘1’ and the other as ‘0’.
E.g. data set of 2000 samples with 10 positive and 1990 negative. If we assign disregarding all input , we will have accuracy of which seems quiet high - however it doesn’t learn anything.
Some other metric that we can think of is:
- Precision/ Recall
- F1 score
- ROC curve
- AUC

One way to remember this is,
TP = True Positive = Truly predicted as Positive
FN = False Negative = Falsely predicted as Negative
Precision/Recall
- Precision: Of all the prediction predicted as positive, what percentage of them are truly positive.
- Recall: Of all the actual positive, what percentage of them are predicted as positive.
Using the figure above:
F1 score
F1 score is a single value that combines both precision and recall. Average doesn’t work well because we wanted to give more weight to the lower of the two (precision and recall) score.

ROC Curve
Very good explanation of ROC and AUC is here. This is basically True Positive Rate vs. False Positive Rate.

AUC is the Area under the ROC curve.
No comments:
Post a Comment